Looking for accurate SEBA Class 9 Maths Exercise 4.3 (Linear Equations in Two Variables) textual solutions for the 2026–27 academic year? Access complete step-by-step solutions covering drawing graphs of linear equations, finding coordinates, work-done and distance problems, force and acceleration linear graphs, and temperature conversion (F = 9/5 C + 32) solutions to score top marks in your annual exams.
EXERCISE 4.3
1. Draw the graph of each of the following linear equations in two variables:
(i) x + y = 4
soln:
Solution:
First of all, we can draw a table for different values of x and y, and then with the help of the values, we can plot a graph for each linear equation.
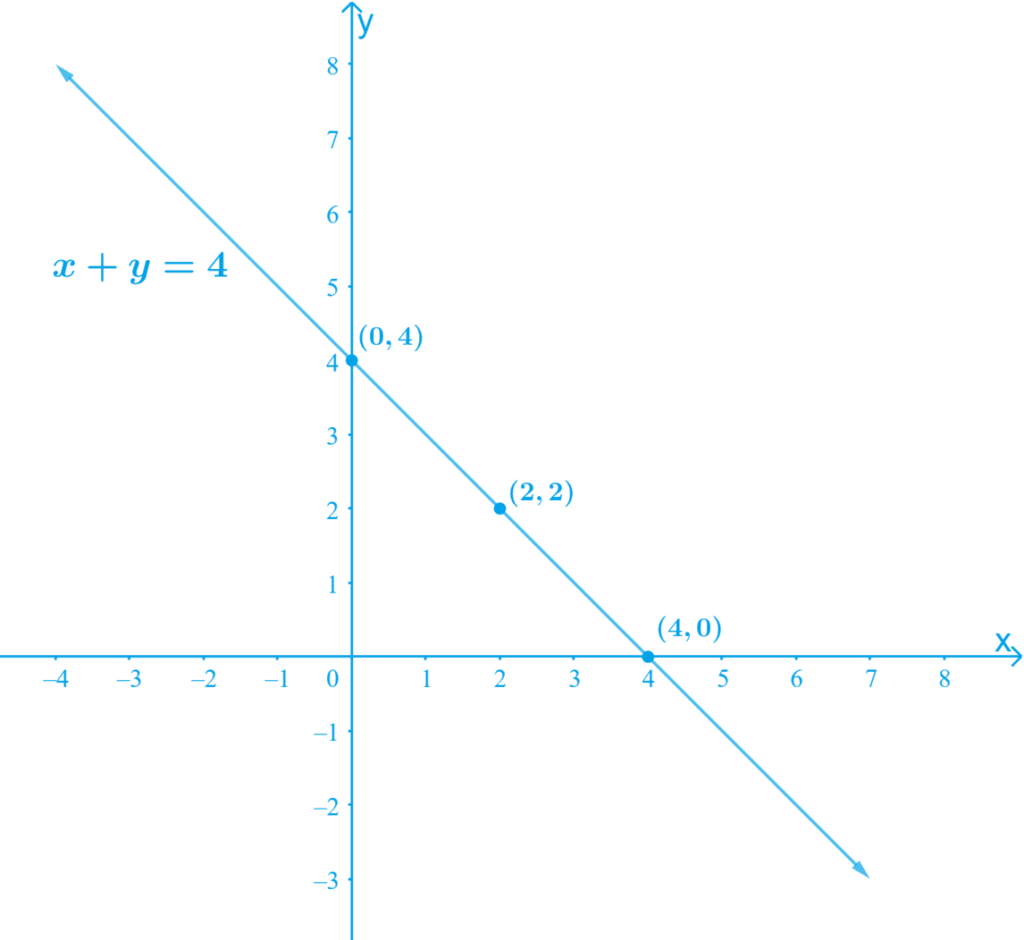
i) x + y = 4
Re-write the equation as y = 4 – x — Equation (1)
By substituting the different values of x in Equation (1), we get different values for y
- When x = 0, we have: y = 4 – 0 = 4
- When x = 2, we have: y = 4 – 2 = 2
- When x = 4, we have: y = 4 – 4 = 0
Thus, we have the following table with all the obtained solutions:
| x | 0 | 2 | 4 |
| y | 4 | 2 | 0 |
Plot the points (0, 4), (4, 0), and (2, 2) on the graph paper and join them to get a straight line.
(ii) x – y = 2
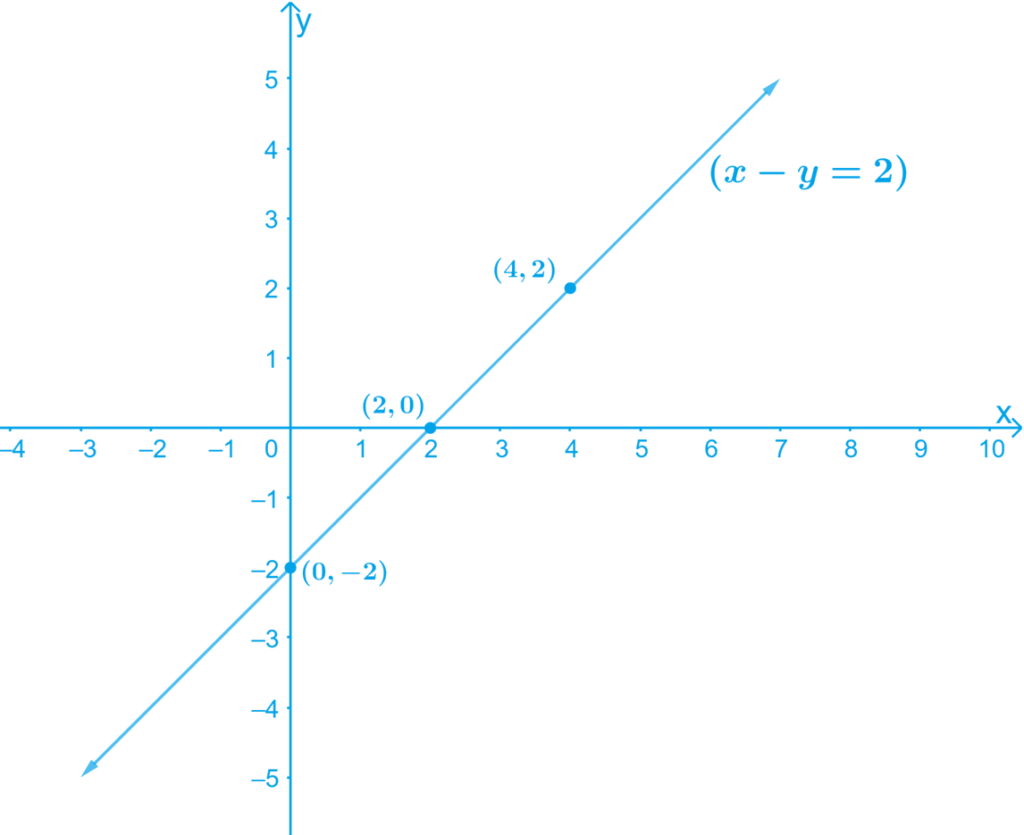
soln:Re-write the equation as y = x – 2 — Equation (1)
By substituting the different values of x in Equation (1) we get different values for y
- When x = 0, we have y = 0 – 2 = -2
- When x = 2, we have y = 2 – 2 = 0
- When x = 4, we have y = 4 – 2 = 2
Thus, we have the following table with all the obtained solutions:
| x | 0 | 2 | 4 |
| y | -2 | 0 | 2 |
By Plotting the points (0, -2), (2, 0) and (4, 2) on the graph paper and drawing a line joining the corresponding points, we obtain the graph.
The graph of the line represented by the given equation is as shown
(iii) y = 3x
soln: By substituting the different values of x in Equation (1) we get different values for y.
- When x = 0, we have: y = 3(0) = 0
- When x = 1, we have: y = 3 (1) = 3
- When x = -1, we have: y = 3(-1) = -3
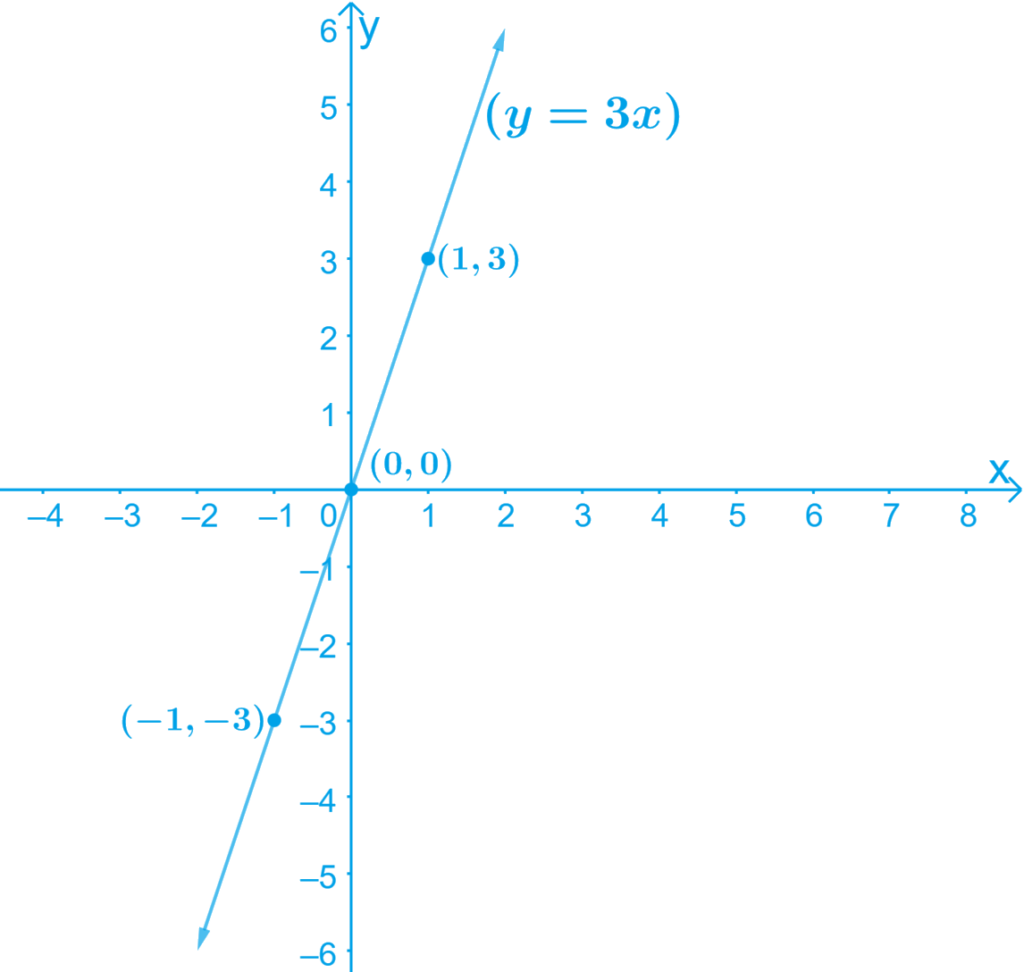
Thus, we have the following table with all the obtained solutions:
| x | 0 | 1 | -1 |
| y | 0 | 3 | -3 |
By Plotting the points (0, 0), (1, 3), and (-1, -3) on the graph paper and drawing a line joining the corresponding points, we obtain the graph.
The graph of the line represented by the given equation is as shown:
(iv) 3 = 2x + y
soln:Re-write the equations
y = 3 – 2x — Equation (1)
By substituting the different values of x in Equation (1) we get different values for y
- When x = 0, we have: y = 3 – 2(0) = 3 – 0 = 3
- When x = 3, we have: y = 3 – 2(3) = 3 – 6 = – 3
- When x = -1, we have: y = 3 – 2 (-1) = 3 + 2 = 5
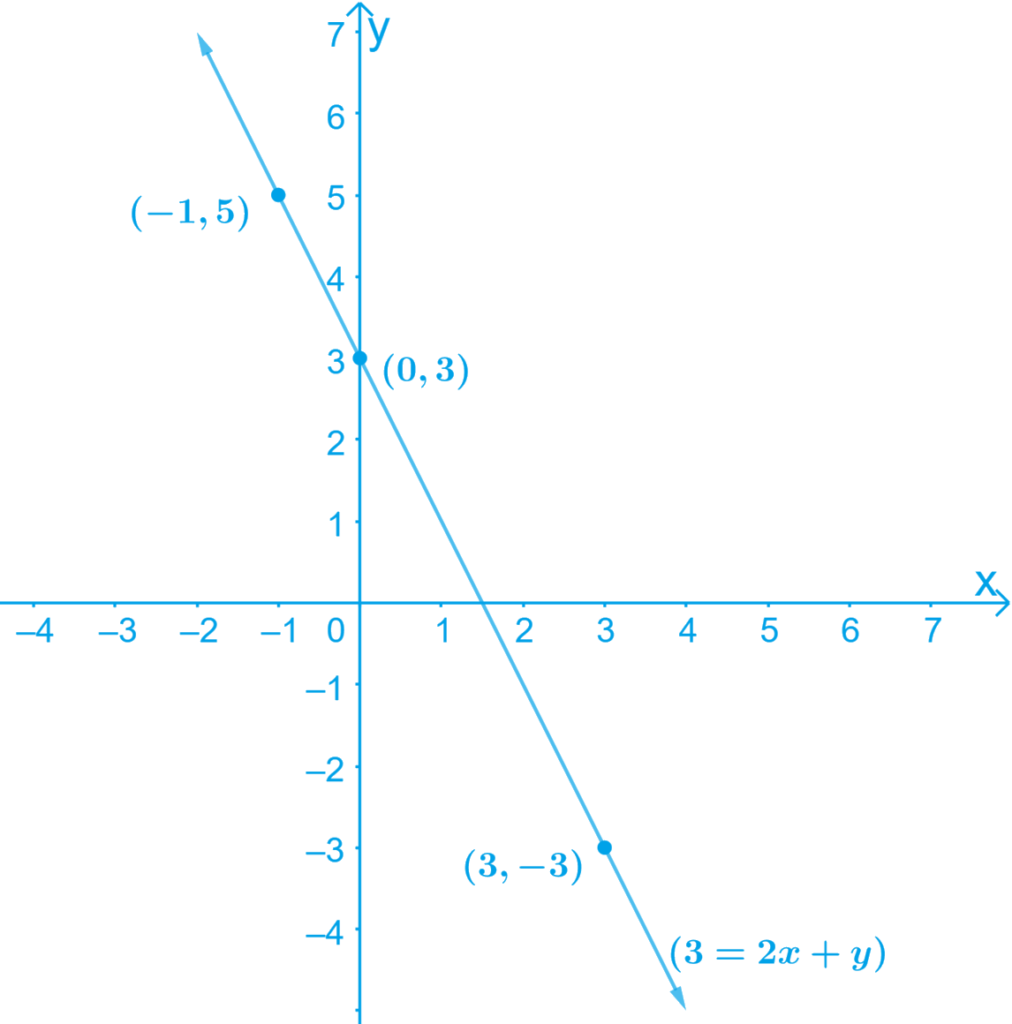
Thus, we have the following table with all the obtained solutions:
| x | 0 | 3 | -1 |
| y | 3 | -3 | 5 |
By plotting the points (0, 3), (3, -3), and (-1, 5) on the graph paper and drawing a line joining the corresponding points, we obtain the graph.
The graph of the line represented by the given equation is as shown.
(v) 2x + 3y = 6
soln: Given linear equation is
2x+3y−6=0
2x=6−3y
x=26−3y
On substituting y = 0, we get
x=26−3×0
x=26−0
x=26
⟹x=3
On substituting y = 2, we get
x=26−3×2
x=26−6
x=20
⟹x=0
Hᴇɴᴄᴇ,
➢ Pair of points of the given equation are shown in the below table.
x03y20
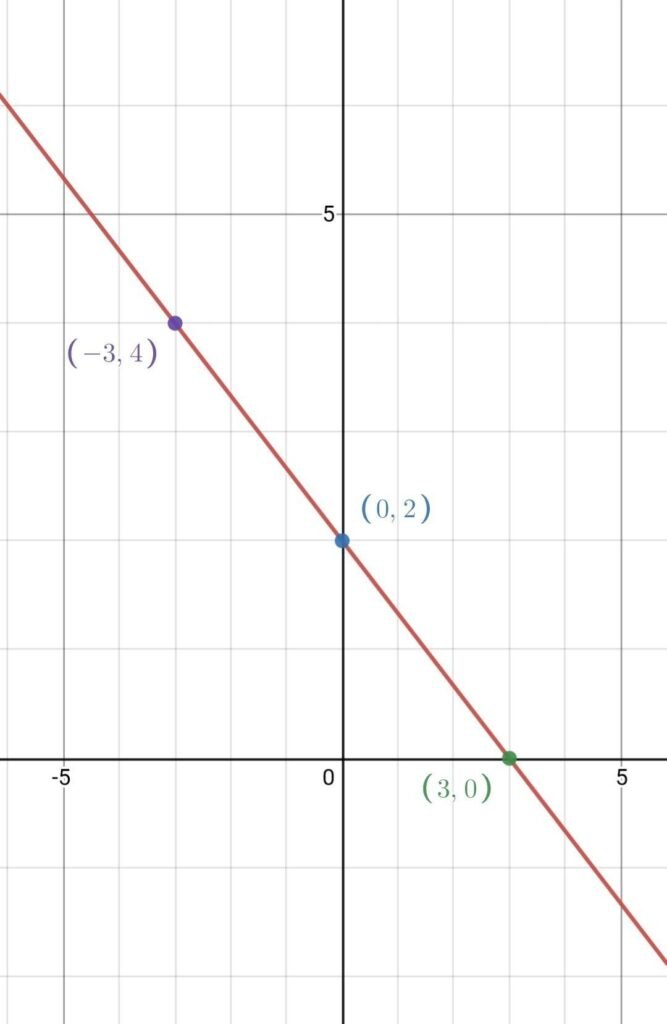
➢ Now draw a graph using the points (0 , 2) & (3 , 0)
➢ See the attachment graph.
So, from graph, we concluded that
(3, 0) lies on the line, So, x = 3 and y = 0 is the solution of the line 2x + 3y = 6
Also, from graph, when y = 4, x = – 3
SEBA Class 9 Maths Exercise 4.3 Solutions
(vi) 3x – y = 7
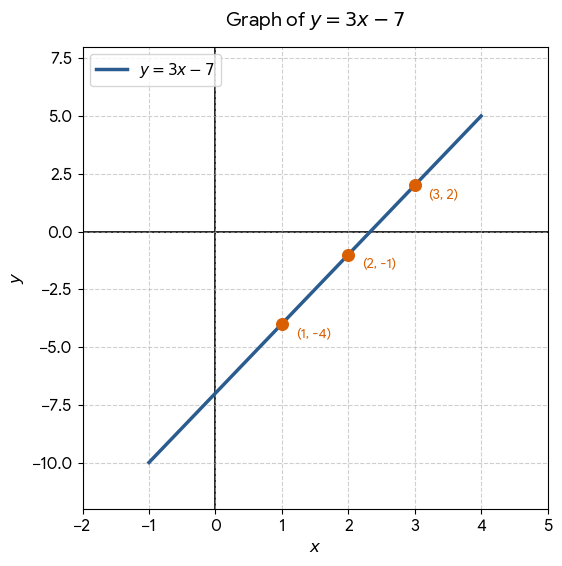
soln: 3x – y = 7 ⟹ y = 3x – 7
Table of values:
| x | 2 | 3 | 1 |
| y | -1 | 2 | -4 |
Plot the points (2, -1), (3, 2), and (1, -4) on the graph paper and join them to get a straight line.
(vii) x + 2y = 8
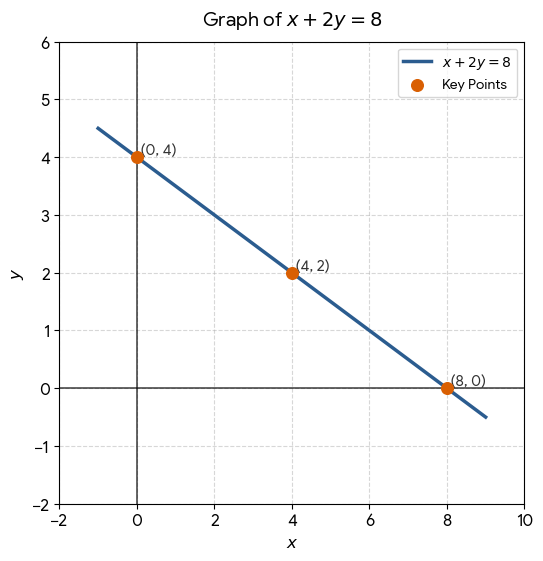
soln: x + 2y = 8 ⟹ x = 8 – 2y
Table of values:
| x | 8 | 0 | 4 |
| y | 0 | 4 | 2 |
Plot the points (8, 0), (0, 4), and (4, 2) on the graph paper and join them to get a straight line.
(viii) y = 2x + 1
soln: Table of values:
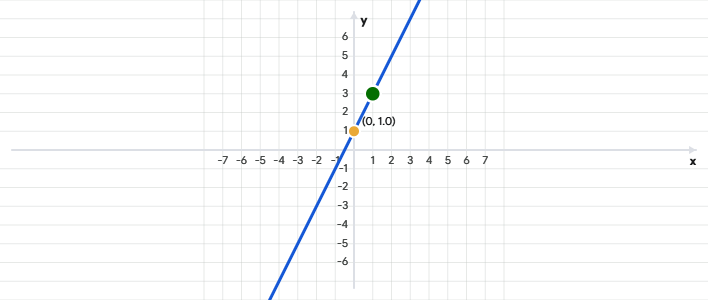
| x | 0 | 1 | -1 |
| y | 1 | 3 | -1 |
Plot the points (0, 1), (1, 3), and (-1, -1) on the graph paper and join them to get a straight line.
Class 9 Maths Chapter 4 Exercise 4.3 Question Answer SEBA 2026-27
2. Give the equations of two lines passing through (2, 14). How many more such lines are there, and why?
soln: Given point: (2, 14)
Equations of two lines passing through (2, 14):
x + y = 16
7x – y = 0
Reason:
There are infinitely many such lines because infinitely many lines can pass through a single given point.
(i) If the point (3, 4) lies on the graph of the equation 3y = ax + 7, find the value of a.
soln: Given equation: 3y = ax + 7
Put x = 3, y = 4:
3(4) = a(3) + 7
12 = 3a + 7
3a = 12 – 7
3a = 5
a = 5/3
(ii) If the point (p, 4) lies on the graph of the equation 4x + y = 16, then find the value of p.
soln: Given equation: 4x + y = 16
Put x = p, y = 4:
4(p) + 4 = 16
4p = 16 – 4
4p = 12
p = 12/4
p = 3
(iii) If the graph of the equation 2y = ax – 4 passes through the point (1, 2) then find the value of a.
soln: Given equation: 2y = ax – 4
Put x = 1, y = 2:
2(2) = a(1) – 4
4 = a – 4
a = 4 + 4
a = 8
Linear Equations Graphs Class 9 SEBA Ex 4.3 Solutions
(iv) If the point (2k – 3, k + 2) lies on the graph of the equation 2x + 3y + 15 = 0 then find k.
soln: Given equation: 2x + 3y + 15 = 0
Put x = 2k – 3, y = k + 2:
2(2k – 3) + 3(k + 2) + 15 = 0
4k – 6 + 3k + 6 + 15 = 0
7k + 15 = 0
7k = -15
k = -15/7
(v) Examine whether the point (1, -2) lies on the graph of the equation 3x – 2y = 7.
soln: Given equation: 3x – 2y = 7
Check for point (1, -2):
LHS = 3(1) – 2(-2) = 3 + 4 = 7
RHS = 7
LHS = RHS
Answer: Yes, the point (1, -2) lies on the graph of the given equation.
(vi) Check whether the point (-3, 2) lies on the graph of the equation 4x + 7y = 9.
soln: Given equation: 4x + 7y = 9
Check for point (-3, 2):
LHS = 4(-3) + 7(2) = -12 + 14 = 2
RHS = 9
LHS ≠ RHS
Answer: No, the point (-3, 2) does not lie on the graph of the given equation.
(vii) Write the condition under which the graph of ax + by + c = 0 passes through origin.
soln: The graph of ax + by + c = 0 passes through the origin (0, 0) if:
a(0) + b(0) + c = 0
c = 0
Condition: c = 0
SEBA Class 9 Maths Chapter 4 Exercise 4.3 Textbook Answers
Class 9 Maths Exercise 4.3 Fahrenheit Celsius Graph
📐 Updated Solutions Notice: This page features complete, step-by-step SEBA Class 9 Mathematics Chapter 4 (Linear Equations in Two Variables) Exercise 4.3 Textual Solutions updated for the 2026–27 academic session. All Cartesian coordinate plotting, straight-line graphing methods, force-work equations, and temperature scale conversion calculations strictly follow the latest revised Assam Board (SEBA) curriculum.
💡 Master Class 9 Algebra Concepts:
- Having difficulty plotting linear graphs on coordinate axes, finding point intersections, or working with the Fahrenheit-Celsius conversion formula in Exercise 4.3? Drop your questions in the comments section below!
- Save and bookmark this solution guide for quick reference before your unit tests, mid-term, and annual examinations.
- Share this link with your classmates and WhatsApp study groups to help them excel in mathematics!