Looking for complete, step-by-step textbook solutions for SEBA Class 10 Mathematics Chapter 13 (Statistics – Exercise 13.1) for the 2026–27 academic session? Access verified, board-pattern solutions to all 9 textual questions on finding the mean of grouped data. Master calculations using the Direct Method (x̄ = Σ(f_i * x_i) / Σf_i), Assumed Mean Method (x̄ = a + Σ(f_i * d_i) / Σf_i), and Step-Deviation Method (x̄ = a + (Σ(f_i * u_i) / Σf_i) * h). Includes complete table setups for daily pocket allowance problems with missing frequency f, daily wages of factory workers, literacy rates of cities, concentration of SO2 in air, number of plants in houses, and exam-oriented model solutions designed strictly according to the Assam Board (SEBA) HSLC blueprint.
EXERCISE 13.1
1. A survey was conducted by a group of students as a part of their environment awareness programme, in which they collected the following data regarding the number of plants in 20 houses in a locality. Find the mean number of plants per house.

Which method did you use for finding the mean, and why?
Soln: Formula:
Class mark (xᵢ) = (Upper limit + Lower limit) / 2
Mean (x̄) = Σfᵢxᵢ / Σfᵢ
| Class Interval | Frequency (fi) | Class Mark (xi) | fixi |
| 0 – 2 | 1 | 1 | 1 |
| 2 – 4 | 2 | 3 | 6 |
| 4 – 6 | 1 | 5 | 5 |
| 6 – 8 | 5 | 7 | 35 |
| 8 – 10 | 6 | 9 | 54 |
| 10 – 12 | 2 | 11 | 22 |
| 12 – 14 | 3 | 13 | 39 |
| Total | Σf_i = 20 | — | Σf_i x_i = 162 |
Mean (x̄) = Σfᵢxᵢ / Σfᵢ
x̄ = 162 / 20
x̄ = 8.1
Direct method is used because the numerical values of both class marks (xᵢ) and frequencies (fᵢ) are small.
Ans: Mean number of plants per house = 8.1
2. Consider the following distribution of daily wages of 50 workers of a factory.

Find the mean daily wages of the workers of the factory by using an appropriate method.
Soln: Assumed mean (a) = 150 Class size (h) = 20 uᵢ = (xᵢ – a) / h = (xᵢ – 150) / 20
| Class Interval | fi | xi | ui=20xi−150 | fiui |
| 100 – 120 | 12 | 110 | -2 | -24 |
| 120 – 140 | 14 | 130 | -1 | -14 |
| 140 – 160 | 8 | 150 | 0 | 0 |
| 160 – 180 | 6 | 170 | 1 | 6 |
| 180 – 200 | 10 | 190 | 2 | 20 |
| Total | Σf_i = 50 | — | — | Σf_i u_i = -12 |
Formula:
Mean (x̄) = a + (Σfᵢuᵢ / Σfᵢ) × h
Substitution:
x̄ = 150 + (-12 / 50) × 20
x̄ = 150 – (240 / 50)
x̄ = 150 – 4.8
x̄ = 145.20
Ans: Mean daily wages of the workers = Rs 145.20
3. The following distribution shows the daily pocket allowance of children of a locality. The mean pocket allowance is Rs 18. Find the missing frequency f.

Soln: Given: Mean (x̄) = 18 Assumed mean (a) = 18 dᵢ = xᵢ – a = xᵢ – 18
| Class Interval | fi | xi | di=xi−18 | fidi |
| 11 – 13 | 7 | 12 | -6 | -42 |
| 13 – 15 | 6 | 14 | -4 | -24 |
| 15 – 17 | 9 | 16 | -2 | -18 |
| 17 – 19 | 13 | 18 | 0 | 0 |
| 19 – 21 | $f$ | 20 | 2 | $2f$ |
| 21 – 23 | 5 | 22 | 4 | 20 |
| 23 – 25 | 4 | 24 | 6 | 24 |
| Total | Σf_i = 44 + f | — | — | Σf_i d_i = 2f – 40 |
Formula:
Mean (x̄) = a + (Σfᵢdᵢ / Σfᵢ)
Substitution:
18 = 18 + (2f – 40) / (44 + f)
0 = (2f – 40) / (44 + f)
2f – 40 = 0
2f = 40
f = 20
Ans: Missing frequency f = 20
SEBA Class 10 Maths Exercise 13.1 Solutions
4. Thirty women were examined in a hospital by a doctor and the number of heart beats per minute were recorded and summarised as follows. Find the mean heart beats per minute for these women, choosing a suitable method.

Soln: Assumed mean (a) = 75.5 Class size (h) = 3 uᵢ = (xᵢ – a) / h = (xᵢ – 75.5) / 3
| Class Interval | fi | xi | ui | fiui |
| 65 – 68 | 2 | 66.5 | -3 | -6 |
| 68 – 71 | 4 | 69.5 | -2 | -8 |
| 71 – 74 | 3 | 72.5 | -1 | -3 |
| 74 – 77 | 8 | 75.5 | 0 | 0 |
| 77 – 80 | 7 | 78.5 | 1 | 7 |
| 80 – 83 | 4 | 81.5 | 2 | 8 |
| 83 – 86 | 2 | 84.5 | 3 | 6 |
| Total | Σf_i = 30 | — | — | Σf_i u_i = 4 |
Formula:
Mean (x̄) = a + (Σfᵢuᵢ / Σfᵢ) × h
Substitution:
x̄ = 75.5 + (4 / 30) × 3
x̄ = 75.5 + 4 / 10
x̄ = 75.5 + 0.4
x̄ = 75.9
Ans: Mean heart beats per minute = 75.9
5. In a retail market, fruit vendors were selling mangoes kept in packing boxes. These boxes contained varying number of mangoes. The following was the distribution of mangoes according to the number of boxes.

Find the mean number of mangoes kept in a packing box. Which method of finding the mean did you choose?
Soln: The given class intervals are inclusive. Converting into continuous class intervals by subtracting 0.5 from lower limit and adding 0.5 to upper limit:
Class size (h) = 3 Assumed mean (a) = 57 uᵢ = (xᵢ – 57) / 3
| Class Interval | fi | xi | ui | fiui |
| 49.5 – 52.5 | 15 | 51 | -2 | -30 |
| 52.5 – 55.5 | 110 | 54 | -1 | -110 |
| 55.5 – 58.5 | 135 | 57 | 0 | 0 |
| 58.5 – 61.5 | 115 | 60 | 1 | 115 |
| 61.5 – 64.5 | 25 | 63 | 2 | 50 |
| Total | Σf_i = 400 | — | — | Σf_i u_i = 25 |
Formula:
Mean (x̄) = a + (Σfᵢuᵢ / Σfᵢ) × h
Substitution:
x̄ = 57 + (25 / 400) × 3
x̄ = 57 + 75 / 400
x̄ = 57 + 0.1875
x̄ ≈ 57.19
Step-deviation method was chosen because the values of xᵢ and fᵢ are large and the class size is uniform.
Ans: Mean number of mangoes = 57.19
6. The table below shows the daily expenditure on food of 25 households in a locality.
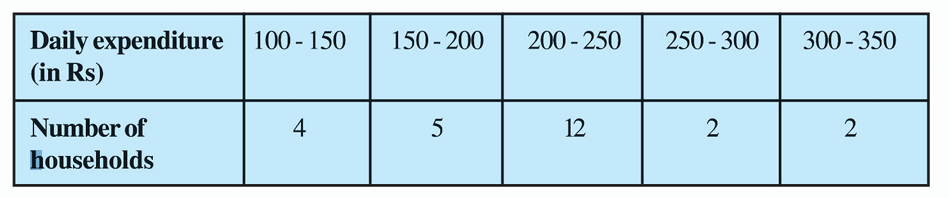
Find the mean daily expenditure on food by a suitable method.
Soln: Assumed mean (a) = 225 Class size (h) = 50 uᵢ = (xᵢ – 225) / 50
| Class Interval | fi | xi | ui | fiui |
| 100 – 150 | 4 | 125 | -2 | -8 |
| 150 – 200 | 5 | 175 | -1 | -5 |
| 200 – 250 | 12 | 225 | 0 | 0 |
| 250 – 300 | 2 | 275 | 1 | 2 |
| 300 – 350 | 2 | 325 | 2 | 4 |
| Total | Σf_i = 25 | — | — | Σf_i u_i = -7 |
Formula: Mean (x̄) = a + (Σfᵢuᵢ / Σfᵢ) × h
Substitution: x̄ = 225 + (-7 / 25) × 50 x̄ = 225 + (-7) × 2 x̄ = 225 – 14 x̄ = 211
Ans: Mean daily expenditure on food = Rs 211
Class 10 Maths Chapter 13.1 Statistics SEBA 2026-27
7. To find out the concentration of SO₂ in the air (in parts per million, i.e., ppm), the data was collected for 30 localities in a certain city and is presented below:
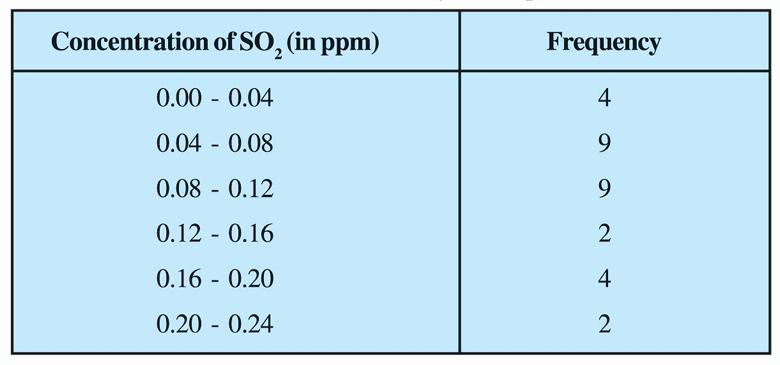
Find the mean concentration of SO₂ in the air.
Soln: Formula: Mean (x̄) = Σfᵢxᵢ / Σfᵢ
| Concentration (ppm) | fi | xi | fixi |
| 0.00 – 0.04 | 4 | 0.02 | 0.08 |
| 0.04 – 0.08 | 9 | 0.06 | 0.54 |
| 0.08 – 0.12 | 9 | 0.10 | 0.90 |
| 0.12 – 0.16 | 2 | 0.14 | 0.28 |
| 0.16 – 0.20 | 4 | 0.18 | 0.72 |
| 0.20 – 0.24 | 2 | 0.22 | 0.44 |
| Total | Σf_i= 30 | — | Σf_ i x_i = 2.96 |
Substitution:
x̄ = Σfᵢxᵢ / Σfᵢ x̄
= 2.96 / 30 x̄ ≈ 0.099 ppm
Ans: Mean concentration of SO₂ in the air = 0.099 ppm
8. A class teacher has the following absentee record of 40 students of a class for the whole term. Find the mean number of days a student was absent.

Note: The class intervals have unequal widths, so the direct method is used.
Soln: Formula:
Class mark (xᵢ) = (Lower limit + Upper limit) / 2
Mean (x̄) = Σfᵢxᵢ / Σfᵢ
| Class Interval | fi | xi | fixi |
| 0 – 6 | 11 | 3 | 33 |
| 6 – 10 | 10 | 8 | 80 |
| 10 – 14 | 7 | 12 | 84 |
| 14 – 20 | 4 | 17 | 68 |
| 20 – 28 | 4 | 24 | 96 |
| 28 – 38 | 3 | 33 | 99 |
| 38 – 40 | 1 | 39 | 39 |
| Total | Σf_i = 40 | — | Σf_i x_i = 499 |
Substitution:
x̄ = 499 / 40
x̄ = 12.475 days (or 12.48 days)
Ans: Mean number of days a student was absent = 12.48 days
9. The following table gives the literacy rate (in percentage) of 35 cities. Find the mean literacy rate.

Soln: Assumed mean (a) = 70 Class size (h) = 10 uᵢ = (xᵢ – 70) / 10
| Class Interval | fi | xi | ui | fiui |
| 45 – 55 | 3 | 50 | -2 | -6 |
| 55 – 65 | 10 | 60 | -1 | -10 |
| 65 – 75 | 11 | 70 | 0 | 0 |
| 75 – 85 | 8 | 80 | 1 | 8 |
| 85 – 95 | 3 | 90 | 2 | 6 |
| Total | Σf_i = 35 | — | — | Σf_ i u_i = -2 |
Formula: Mean (x̄) = a + (Σfᵢuᵢ / Σfᵢ) × h
Substitution: x̄ = 70 + (-2 / 35) × 10 x̄
= 70 – 20 / 35 x̄
= 70 – 0.57 x̄
= 69.43%
Ans: Mean literacy rate = 69.43%
10. Mean of 10 observations is 2.5. If one observation, namely 2.5 is delated, determine the new mean.
Soln: Given:
Number of observations (n) = 10
Mean (x̄) = 2.5
Total sum of 10 observations:
Σx = n × x̄ Σx
= 10 × 2.5
= 25
One observation equal to 2.5 is deleted.
New number of observations (n’) = 10 – 1 = 9
New sum of observations (Σx’) = 25 – 2.5 = 22.5
New Mean = Σx’ / n’ New Mean = 22.5 / 9 New Mean = 2.5
Ans: New mean = 2.5
SEBA Class 10 Maths Ex 13.1 Question Answer
11. If the mean of marks of five students is 33 and mean of the marks of first four of them is 32.5, then find the marks obtained by the 5th student.
Soln: Given:
Number of students (n) = 5
Mean marks of 5 students = 33
Total marks of 5 students = 5 × 33
= 165
Mean marks of first 4 students = 32.5
Total marks of first 4 students = 4 × 32.5 = 130
Marks obtained by 5th student = (Total marks of 5 students) – (Total marks of first 4 students) Marks obtained by 5th student = 165 – 130 Marks obtained by 5th student = 35
Ans: Marks obtained by the 5th student = 35
12. Mean of 25 observations was found to be 78.4. But later on it was discovered that 96 was misread as 69. Find the correct mean.
Soln: Given: Number of observations (n) = 25 Incorrect mean = 78.4
Incorrect sum of observations = n × (Incorrect mean) Incorrect sum = 25 × 78.4 = 1960
Correction in sum: Incorrect value = 69 Correct value = 96
Correct sum = (Incorrect sum) – (Incorrect value) + (Correct value)
Correct sum = 1960 – 69 + 96
Correct sum = 1987
Correct Mean = Correct sum / n Correct Mean = 1987 / 25 Correct Mean = 79.48
Ans: Correct mean = 79.48
SEBA HSLC Class 10 Maths Chapter 13 Exercise 13.1 Solved PDF
13. In the following frequency distribution, the frequency of the class interval (40-50) is missing. It is known that the mean of the distribution is 52. Find the missing frequency.

Soln: Let the missing frequency of the class interval (40-50) be f.
Given Mean (x̄) = 52
| Class Interval | f_i | x_i | f_i x_i |
| 10 – 20 | 5 | 15 | 75 |
| 20 – 30 | 3 | 25 | 75 |
| 30 – 40 | 4 | 35 | 140 |
| 40 – 50 | f | 45 | 45f |
| 50 – 60 | 2 | 55 | 110 |
| 60 – 70 | 6 | 65 | 390 |
| 70 – 80 | 13 | 75 | 975 |
| Total | Σf_i = 33 + f | — | Σf_i x_i= 1765 + 45f |
Formula:
Mean (x̄) = Σfᵢxᵢ / Σfᵢ
Substitution:
52 = (1765 + 45f) / (33 + f) 52 × (33 + f) g=1765 + 45f 1716 + 52f = 1765 + 45f 52f – 45f = 1765 – 1716 7f = 49 f = 49 / 7 f = 7
Ans: Missing frequency = 7
Class 10 Mean of Grouped Data Missing Frequency f Solutions Assam Board
14. If x̄ be the mean of x₁, x₂, …, xₙ, then the mean of x₁ + a, x₂ + a, …, xₙ + a is
(a) x̄
(b) x̄ – a
(c) x̄ + na
(d) x̄ + a
Soln: Given: x̄ = (x₁ + x₂ + … + xₙ) / n
New set of observations: (x₁ + a), (x₂ + a), …, (xₙ + a)
New Mean = [(x₁ + a) + (x₂ + a) + … + (xₙ + a)] / n
New Mean = [(x₁ + x₂ + … + xₙ) + (a + a + … n times)] / n
New Mean = [(x₁ + x₂ + … + xₙ) + na] / n
New Mean = [(x₁ + x₂ + … + xₙ) / n] + (na / n)
New Mean = x̄ + a
Correct Option: (d)
Ans: (d) x̄ + a
15. If the mean of x, x+3, x+6, x+9 and x+12 is 10, then the value of x is
(a) 5
(b) 4
(c) 9
(d) 8
Soln: Given: Observations:
x, x + 3, x + 6, x + 9, x + 12
Number of observations (n) = 5
Mean = 10
Formula: Mean = (Sum of observations) / (Number of observations)
Substitution:
10 = [x + (x + 3) + (x + 6) + (x + 9) + (x + 12)] / 5 10
= (5x + 30) / 5 10
= 5(x + 6) / 5 10
= x + 6 x
= 10 – 6 x
= 4
Correct Option: (b)
Ans: (b) 4
📊 HSLC Class 10 Maths Exercise 13.1 Notice: This page features the complete, step-by-step SEBA Class 10 Mathematics Chapter 13 (Statistics) Exercise 13.1 Official Textual Solutions updated for the 2026–27 academic session. Formatted according to the strict HSLC board marking criteria, every numerical problem—from choosing the appropriate method based on value sizes to finding class marks(x_i = (upper limit + lower limit) / 2) and solving for the high-weightage missing frequency f in the daily pocket allowance problem—is worked out with cleanly organized frequency distribution tables to ensure you score full marks in your 3-mark, 4-mark, and 5-mark board exam questions.
💡 Master SEBA Class 10 Statistics:
- Having doubts about when to apply the Step-Deviation method versus the Direct method, setting class intervals with non-continuous ranges (like the mangoes in boxes problem), or calculating the missing frequency f in Question 3? Leave your query in the comments section below!
- Bookmark this page for quick tabular checks and formula verification before your unit tests, pre-board exams, and the upcoming HSLC examinations.
- Share this link with your classmates and WhatsApp study groups to make Class 10 Mathematics statistics calculations fast, systematic, and error-free!